출처 :
http://www.alphaworks.ibm.com/tech/jca
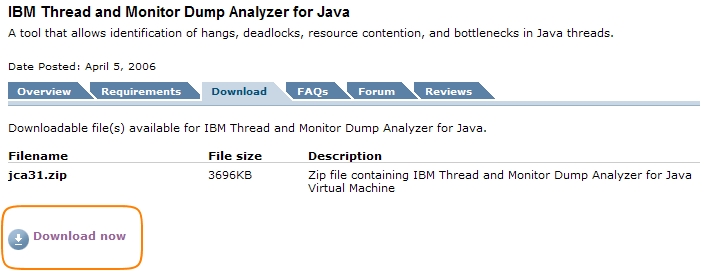
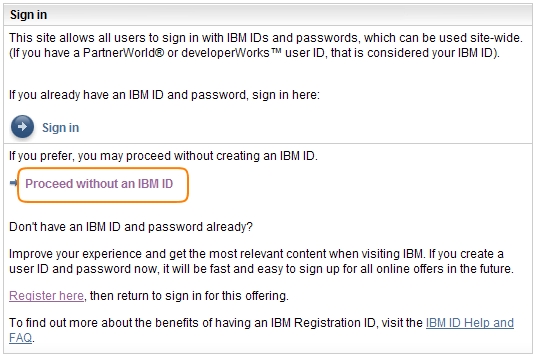
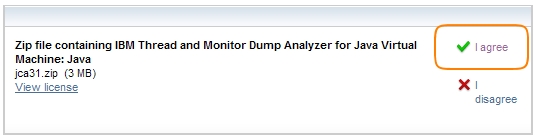
다운로드 :
http://www.alphaworks.ibm.com/tech/jca/download
참고페이지 :
http://starplaying.tistory.com/82
How to run IBM Thread and Monitor Dump Analyzer for Java
You need to use the Java 2 Platform, Standard Edition version 5.0 or higher Java Runtime Environment (JRE) to run IBM Thread and Monitor Dump Analyzer for Java.
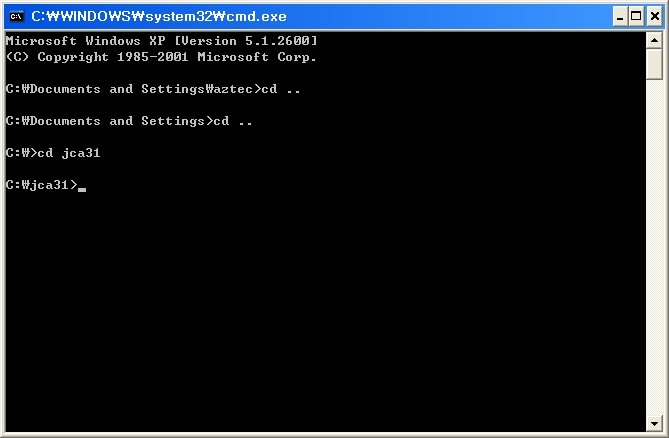
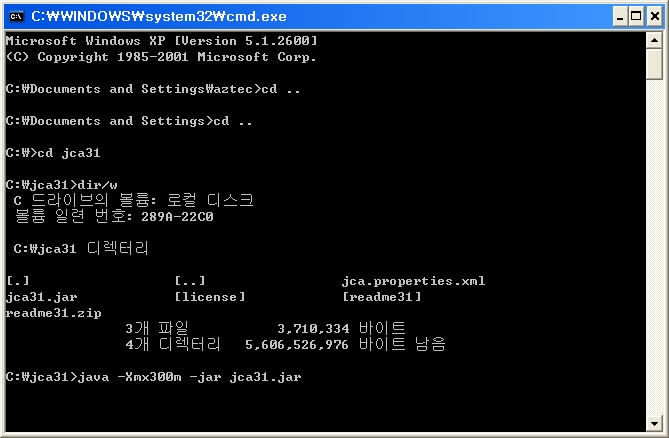
Usage <Java path>java –Xmx[heapsize] –jar jca<Thread and Monitor Dump Analyzer for Java version>.jar [javacore files separated by path delimiter] [analysis output HTML file]
For example,
C:\java\bin\java –Xmx200m –jar jca13.jar
=> Starts IBM Thread and Monitor Dump Analyzer for Java version 1.3 and open javacore files from menu.
/usr/java/bin/java –Xmx200m –jar /usr/jca/jca13.jar /usr/javacore.20060228.171037.2084.txt;/usr/javacore.20060228.171048.2084.txt
=> Starts IBM Thread and Monitor Dump Analyzer for Java version 1.3 with /usr/javacore.20060228.171037.2084.txt and /usr/javacore.20060228.171048.2084.txt
java –Xmx500m –jar jca13.jar /usr/javacore.20060228.171037.2084.txt;/usr/javacore.20060228.171048.2084.txt output.html (On Windows system)
=> Starts IBM Thread and Monitor Dump Analyzer for Java with /usr/javacore.20060228.171037.2084.txt and /usr/javacore.20060228.171048.2084.txt and generates analysis output in output.html without invoking graphical user interface
WARNING: If the analysis output HTML file exists, the tool will overwrite the file.
If there’s java.lang.OutOfMemoryError while you are processing Javacore files, please try increasing the maximum heap size (-Xmx) value to give the JVM more memory.
Maximum heap size should not be larger than the size of available physical memory size for this tool due to performance issue.
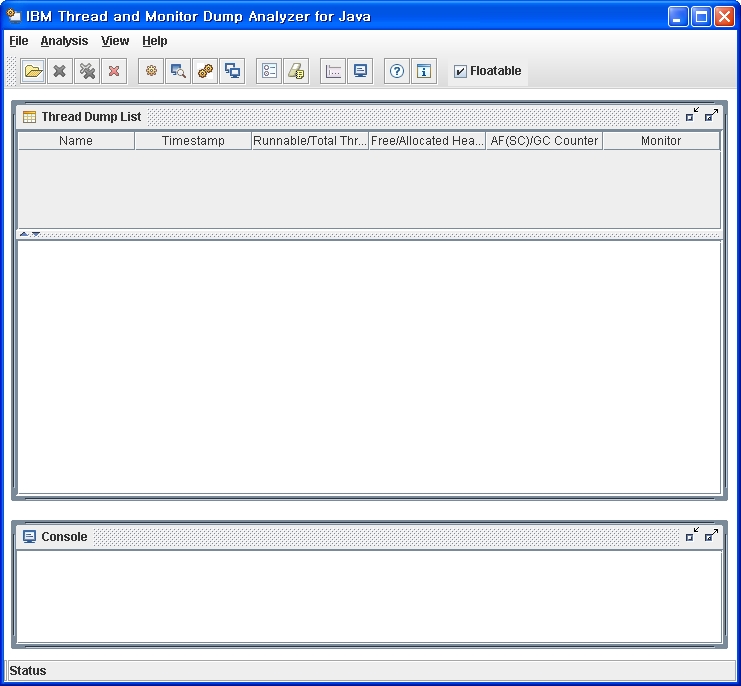
1. Start IBM Thread and Monitor Dump Analyzer for Java
The following screen is a snapshot of the initial screen.
2. Select File-> Open Thread Dumps to open Javacore files if you didn’t specify Javacore files in the command line during the startup.
3. You can select multiple Javacore files
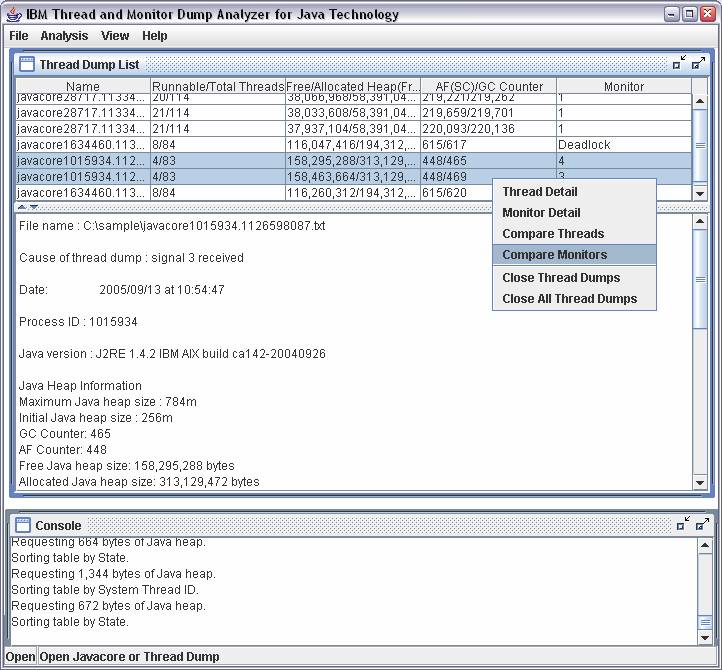
4. Loaded Javacore files are listed in the Thread Dump List table.
Thread Dump List provides the following information:
- Name: The file name of Javacore
- Runnable/Total Threads : Number of runnable and total threads
- Free/Allocated Heap : Amount of free and allocated Java heap
- AF/GC Counter: Allocation Failure and Garbage Collector counter
- Monitor : Number of Monitors locked. Deadlock is displayed if there’s any deadlock in Monitor
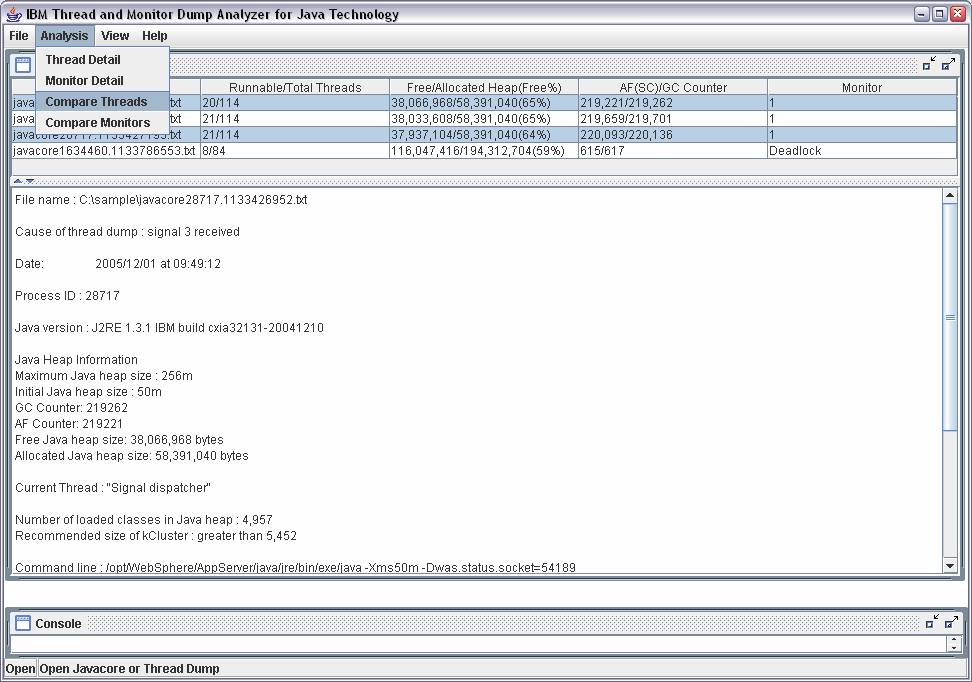
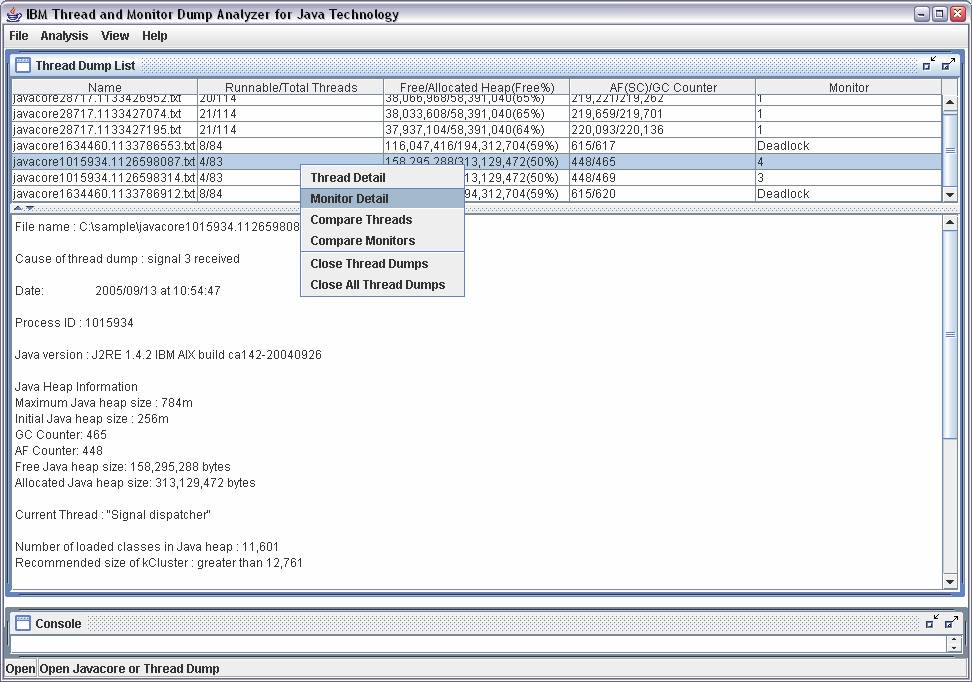
5. Click on a Javacore to display summary of the Javacore.
The following information is displayed for IBM Javacore:
- File name
- Cause of thread dump
- Date
- Process ID
- Java version
- Java Heap Information
- Maximum Java heap size
- Initial Java heap size
- Garbage Collector Counter
- Allocation Failure Counter
- Free Java heap size
- Allocated Java heap size
- Current Thread Name
- Number of loaded classes in Java heap
- Recommended size of kCluster (Only applicable to IBM SDK 1.4.2 and 1.3.1 SR7 or later)
- Java Command line
Non-IBM Javacore ( or thread dump ) provides limited information.
6. Click on Right Button of your mouse to bring up a menu.Or click on Analysis menu to display sub menu
7. The following is Thread Detail View of a Javacore:
Threads are sorted by thread name. Thread Detail View provides the following information:
- Thread Name : The name of a thread
- Thread State : The state of a thread for example, Runnable, Waiting or Suspended
- Method Name : The latest method invoked or predefined status or stack trace pattern for example, IDLE, LISTEN and KEEP-ALIVE
- Java Stack Trace : Java Stack Trace is shown when a thread is selected.
- Native Stack Trace : Native Stack Trace is shown below Java Stack Trace if it’s available
NOTE:
- An IDLE thread is a thread that is ready to receive work but does not have a connection established.
- A KEEP-ALIVE thread is an idle thread that is ready to receive work and does have a connection established.
- A LISTEN thread listens on a port
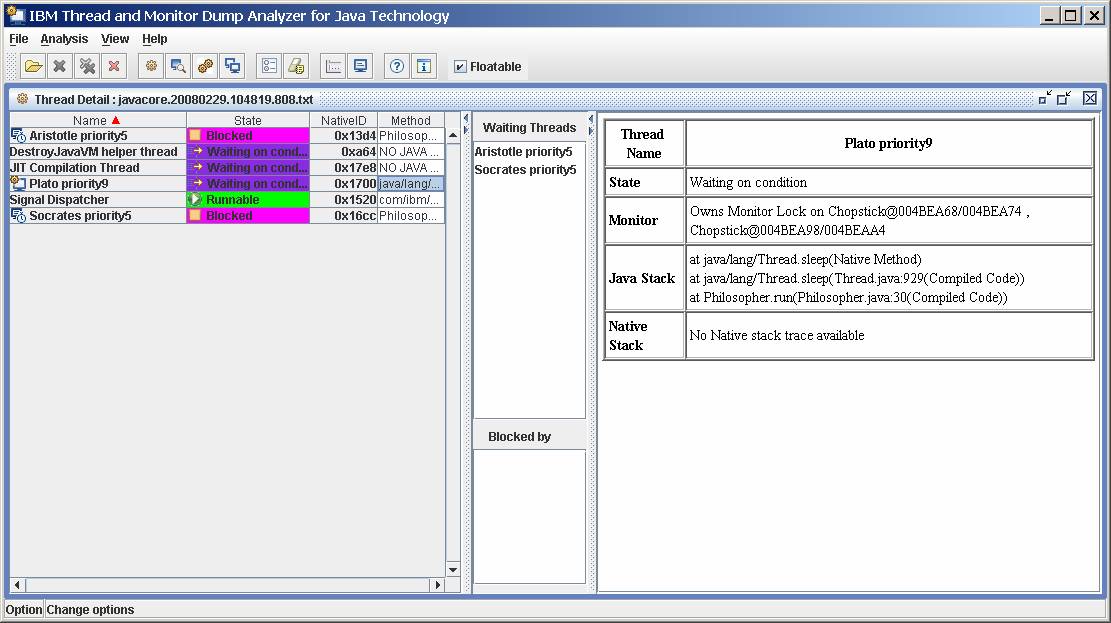
8.If a thread owns monitors, thread name is marked with a special icon and threads that are waiting for monitor lock are displayed.
In the following example, the thread,Plato priority9, has monitor ownership icon. In waiting threads list, Aristotle and Socrates threads are displayed.
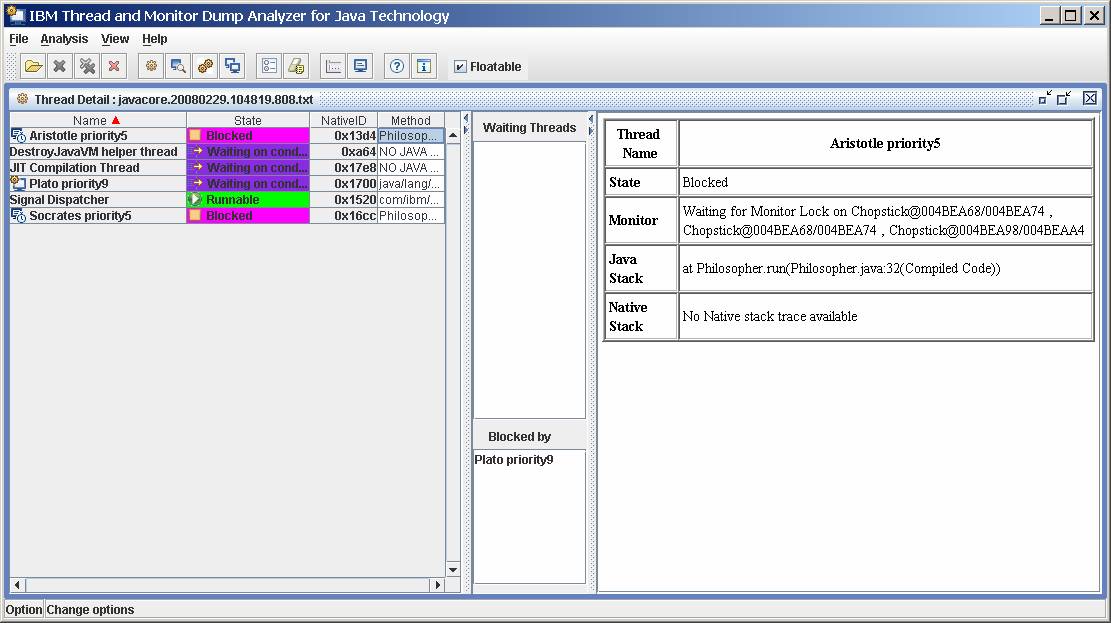
If a thread is waiting for monitor lock, thread name is marked with a special icon and thread that owns monitor lock is displayed.
In the following example, the thread,Aristotle priority5, has waiting for monitor lock icon in name column.
In Blocked by list, Plato priority9 which owns the monitor is displayed:
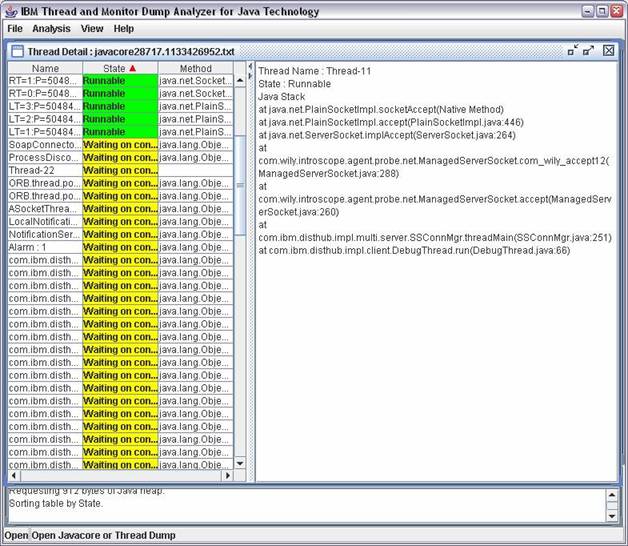
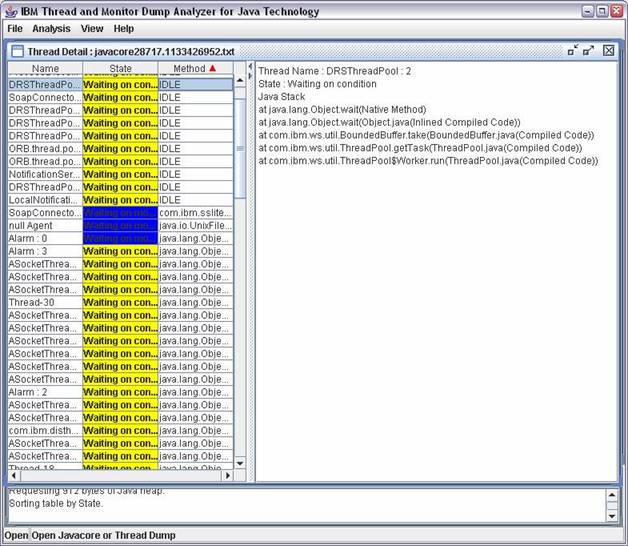
9. You can sort any column by clicking on table header. The following is Thread Detail View sorted by thread state
10. The following is Thread Detail View sorted by method.
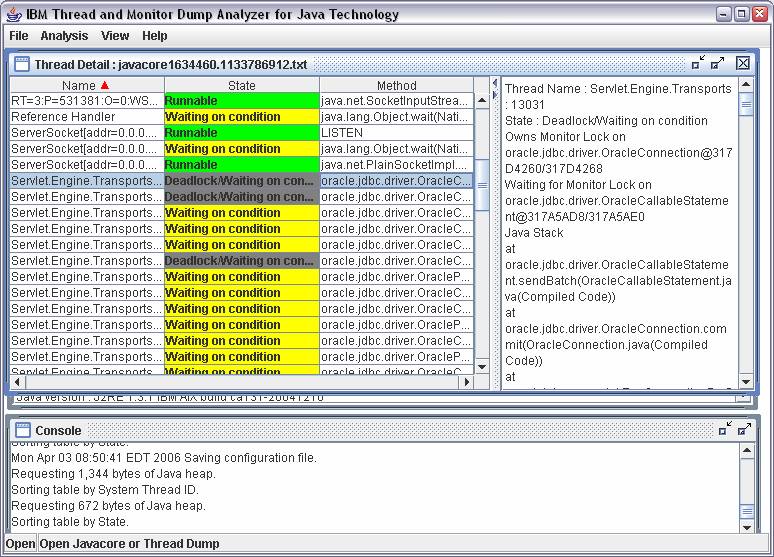
11.Deadlock threads are shown in gray by default as follows:
12. Select multiple Javacore by holding Ctrl key and click on right button of your mouse and select Compare Threads
Or select Analysis -> Compare Threads to display Compre Threads View
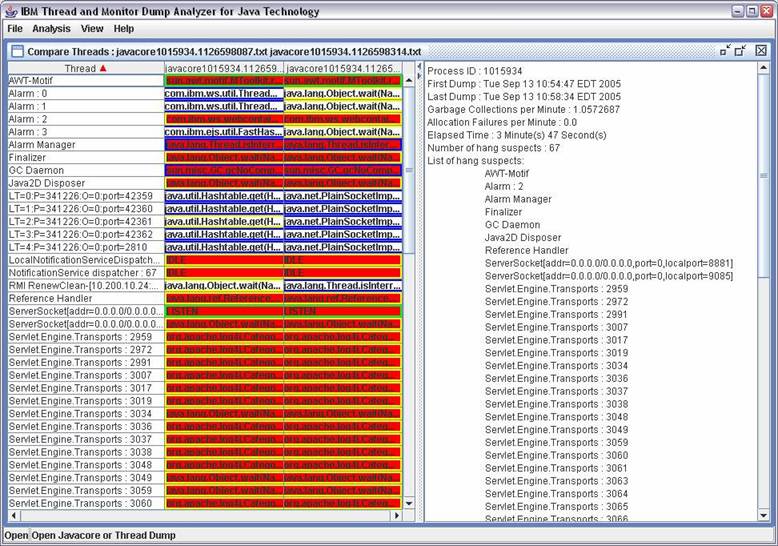
13. The following is Compre Threads View of two Javacore.
Summary is displayed in the right pane. Thread name and method name are displayed from each Javacore on the table.
- Process ID
- First Dump : Timestamp of the first Javacore
- Last Dump : Timestamp of the last Javacore
- Garbage Collections per Minute : Number of Garbage Collections per minute
- Allocation Failures per Minute : Number of Allocation Failures per minute
- Elapsed Time : Time between the first Javacore and the last Javacore
- Number of hang suspects
- List of hang suspects
Red background indicates there’s possible hang in the thread. Green border indicates runnable thread. Blue border indicates waiting on monitor. Yellow border indicates waiting on condition.
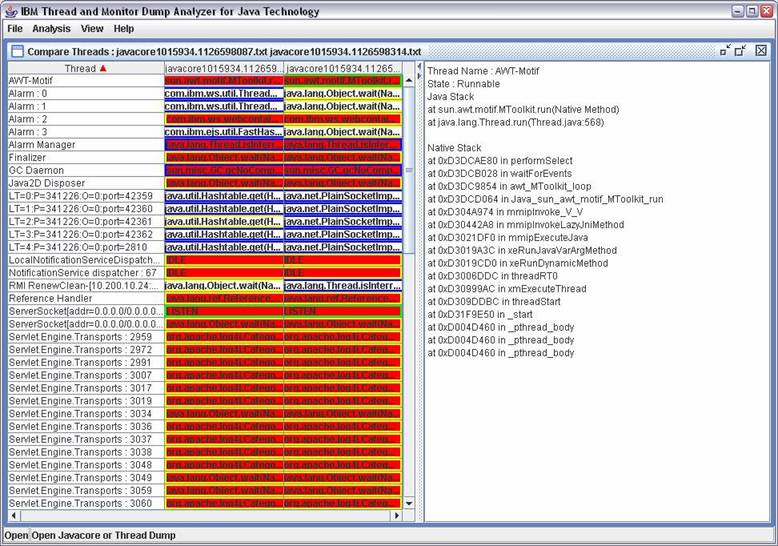
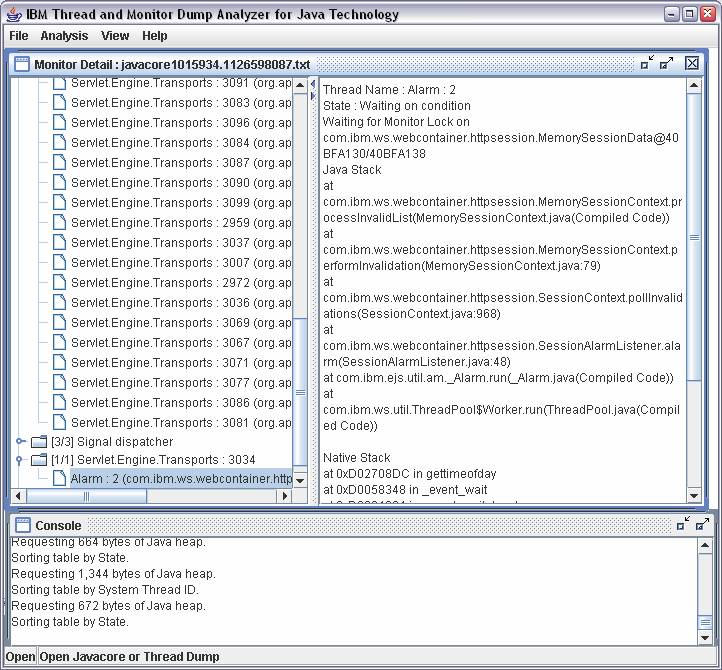
14. Thread summary is displayed when a thread is selected.
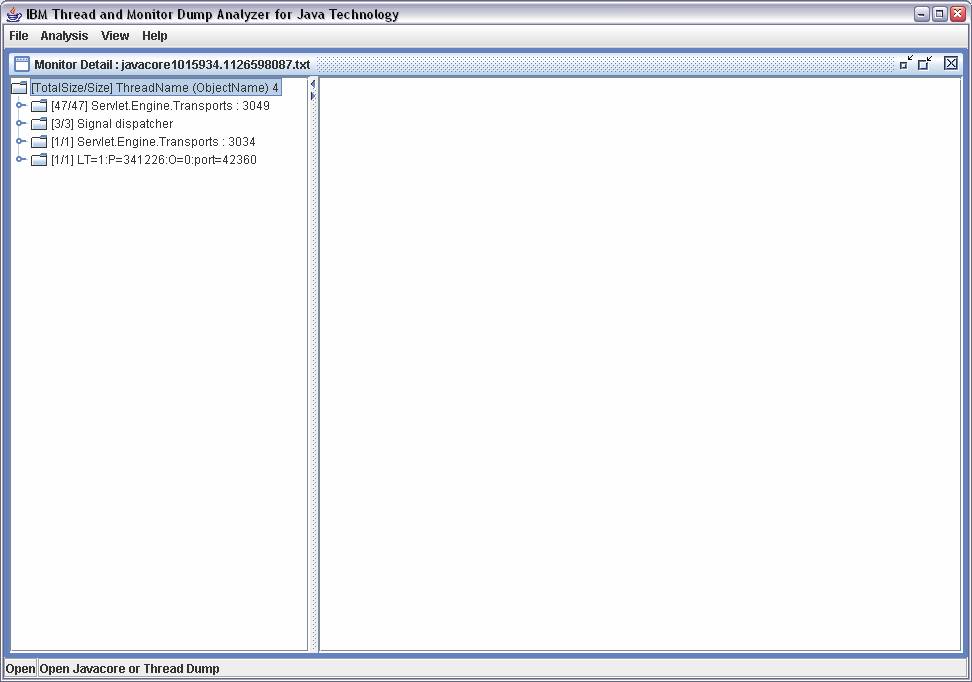
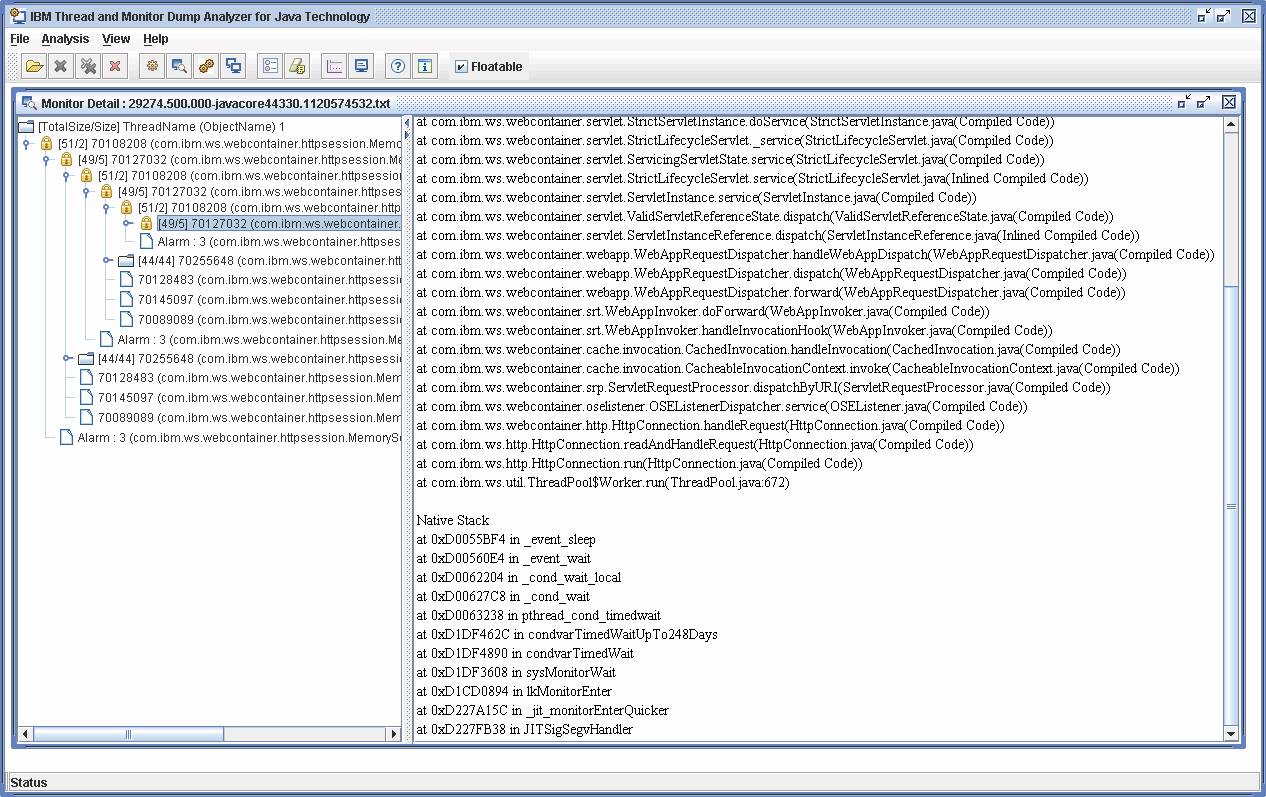
15. Select Monitor Detail to display Monitor Detail View
16. Monitor lock information is displayed in tree format
Total Size is total number of threads directly and indirectly related with a specific monitor.
Size is number of threads directly related with a specific monitor.
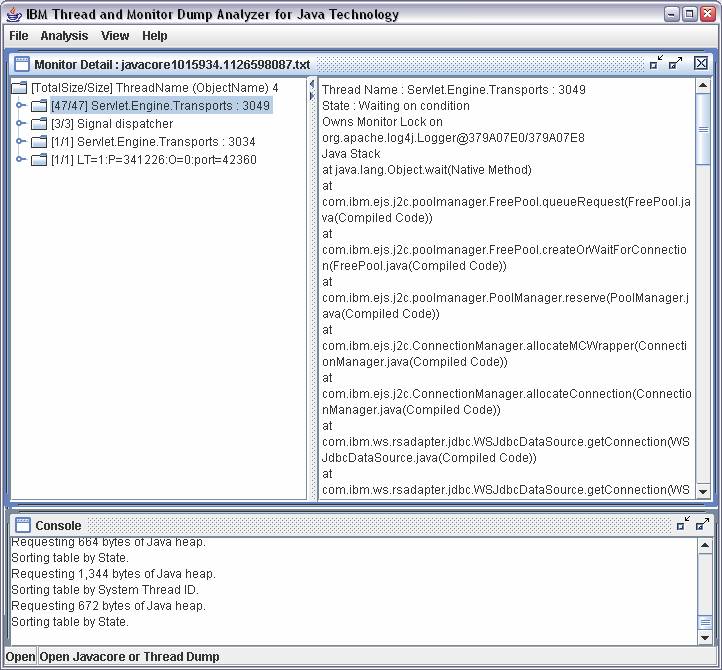
Click on one of the threads.
There are 47 threads waiting for the monitor which is locked by Servlet Engine Transports : 3049
Deadlock threads are displayed with the icon,
as follows:
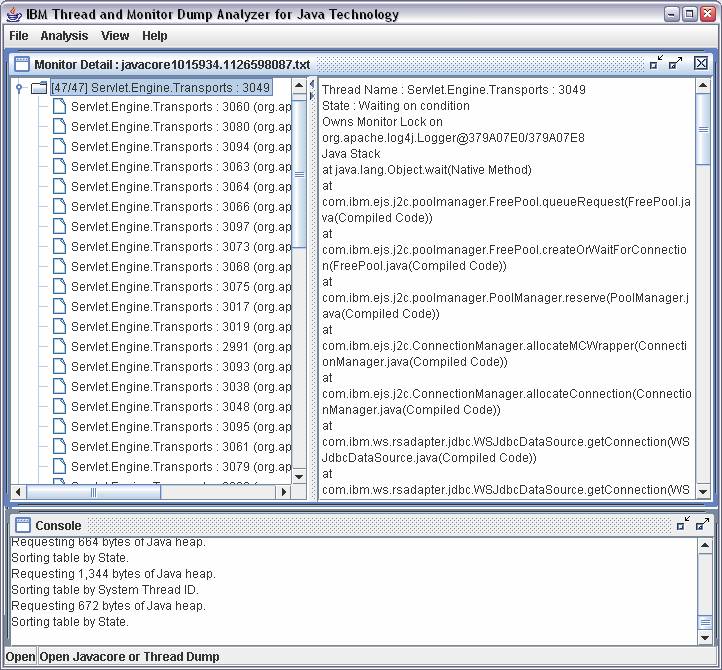
17. You can click on any thread to display detailed information about monitor and thread information
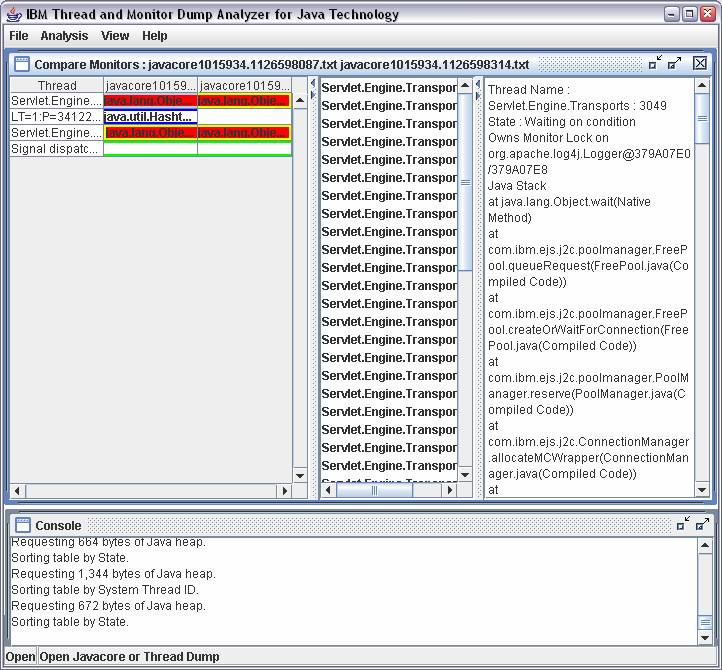
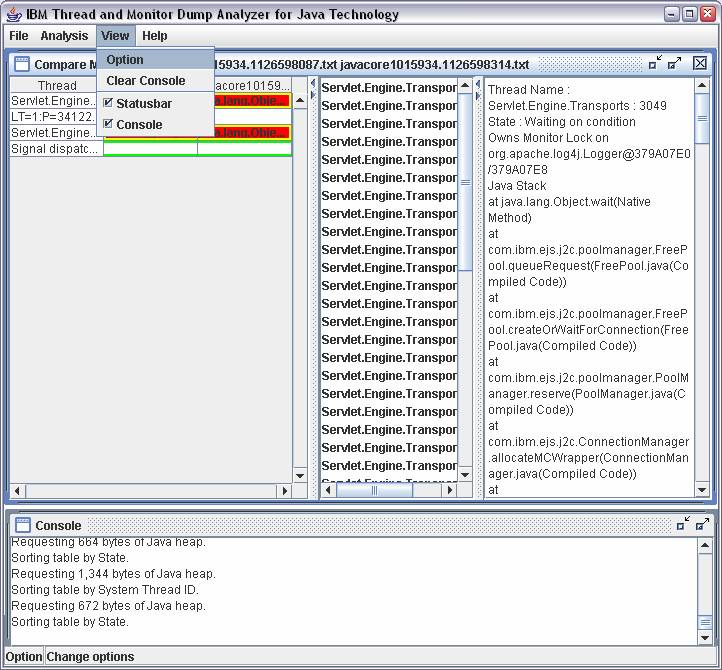
18. You can also compare Monitor in Compare Monitor View. Select Compare Monitors Menu
19. Red line indicates there’s possible hang in a specific thread in Compare Monitors View.
If you click on a thread, list of threads waiting for the locks that the thread owns is displayed in the middle pane. If you click on any thread in the middle pane, thread information is displayed on the right pane.
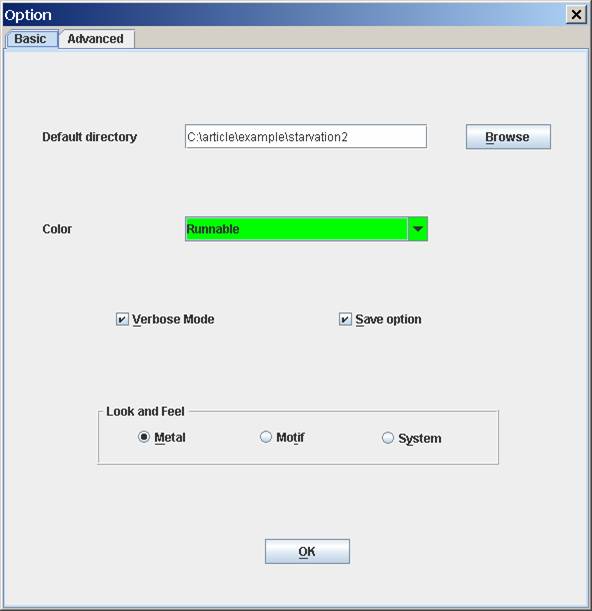
20. Select View-> Option to configure IBM Thread and Monitor Dump Analyzer for Java.
21. You can change default directory, color and other options.
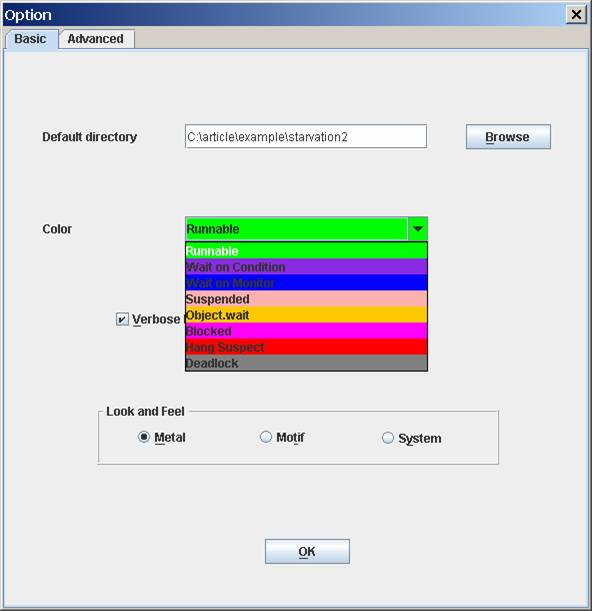
22-1. Select a state in Color and click on Change button to change color.
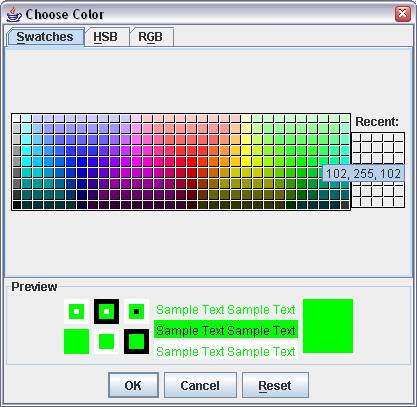
22-2. Select a color and click on OK
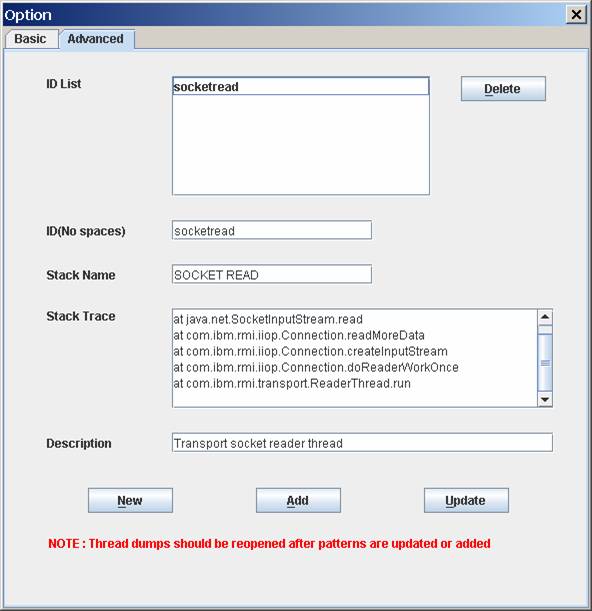
23.In Advanced pane of option , you can customize stack trace pattern recognition engine:
· ID List : ID list of customized stack trace pattern
· ID : Identifier of stack trace pattern. No spaces allowed.
· Stack Name : Stack trace pattern name that is seen from Thread Detail View
· Stack Trace : Stack trace pattern. Syntax : “at package.class.method”. No parenthesis allowed.
· Description : description of a stack trace pattern
· The tool will search for stack trace pattern and display Stack Name in Thread Detail View if any matching is found
· WARNING : Please reopen thread dumps if new stack trace patterns are added if thread dumps are already loaded.
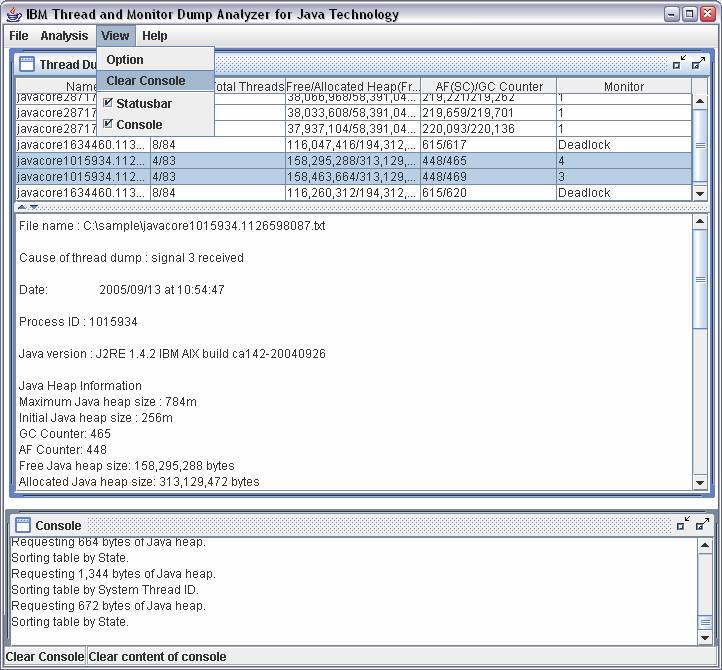
24. You can delete message in console by selecting Clear Console Menu
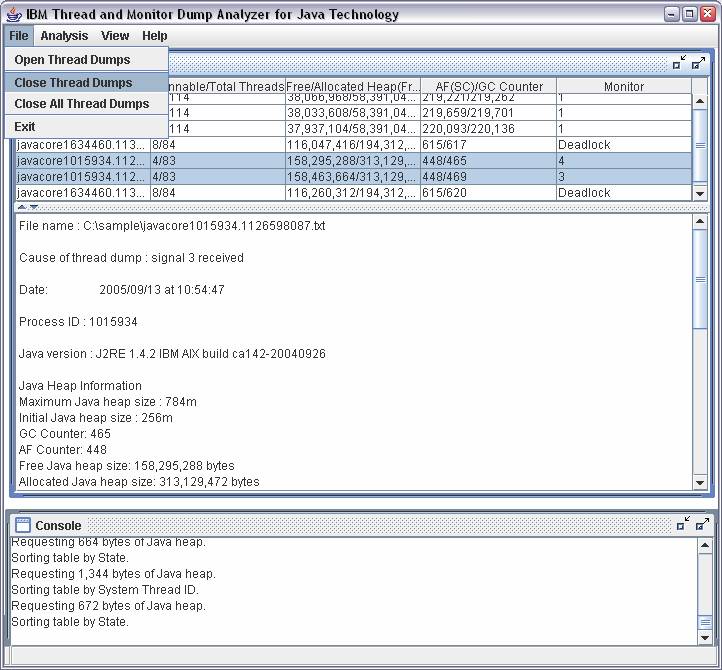
25. Select Close Thread Dumps to unload Javacore files.
26. Help menu displays help screen.
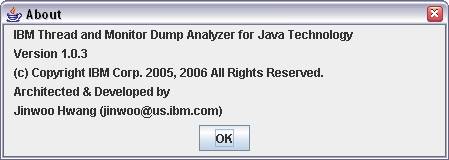
27. Select Help->About to display version information of IBM Thread and Monitor Dump Analyzer for Java
Copyrights and Notices
(C) Copyright IBM Corporation 2005-2008. All Rights Reserved. Note to U.S. Government Users Restricted Rights -- Use, duplication or disclosure restricted by GSA ADP Schedule Contract with IBM Corp.
AIX, Cloudscape, DB2, IBM, iSeries, OS/390, WebSphere, and z/OS are trademarks or registered trademarks of IBM Corporation in the United States and/or other countries.
Java and all Java-based trademarks and logos are trademarks of Sun Microsystems, Inc. in the United States and/or other countries.
Microsoft, Windows, and Windows NT are trademarks of Microsoft Corporation in the United States and/or other countries.
UNIX is a registered trademark of The Open Group.
Other company, product, and service names may be trademarks or service marks of others.
The following paragraph does not apply to the United Kingdom or any other country where such provisions are inconsistent with local law:
INTERNATIONAL BUSINESS MACHINES CORPORATION PROVIDES THIS TOOLS "AS IS" WITHOUT WARRANTY OF ANY KIND, EITHER EXPRESS OR IMPLIED, INCLUDING, BUT NOT LIMITED TO, THE IMPLIED WARRANTIES OR CONDITIONS OF NON-INFRINGEMENT, MERCHANTABILITY OR FITNESS FOR A PARTICULAR PURPOSE. Some states do not allow disclaimer of express or implied warranties in certain transactions, therefore, this statement may not apply to you. This information could include technical inaccuracies or typographical errors. Changes are periodically made to the information herein; these changes will be incorporated in new editions of the tool. IBM may make improvements and/or changes in the product(s) and/or the program(s) described in this tools at any time without notices.
참고페이지 : http://starplaying.tistory.com/82